(Elhossiny et al, 2026, Cancer Discovery) Paper Code
Introduction
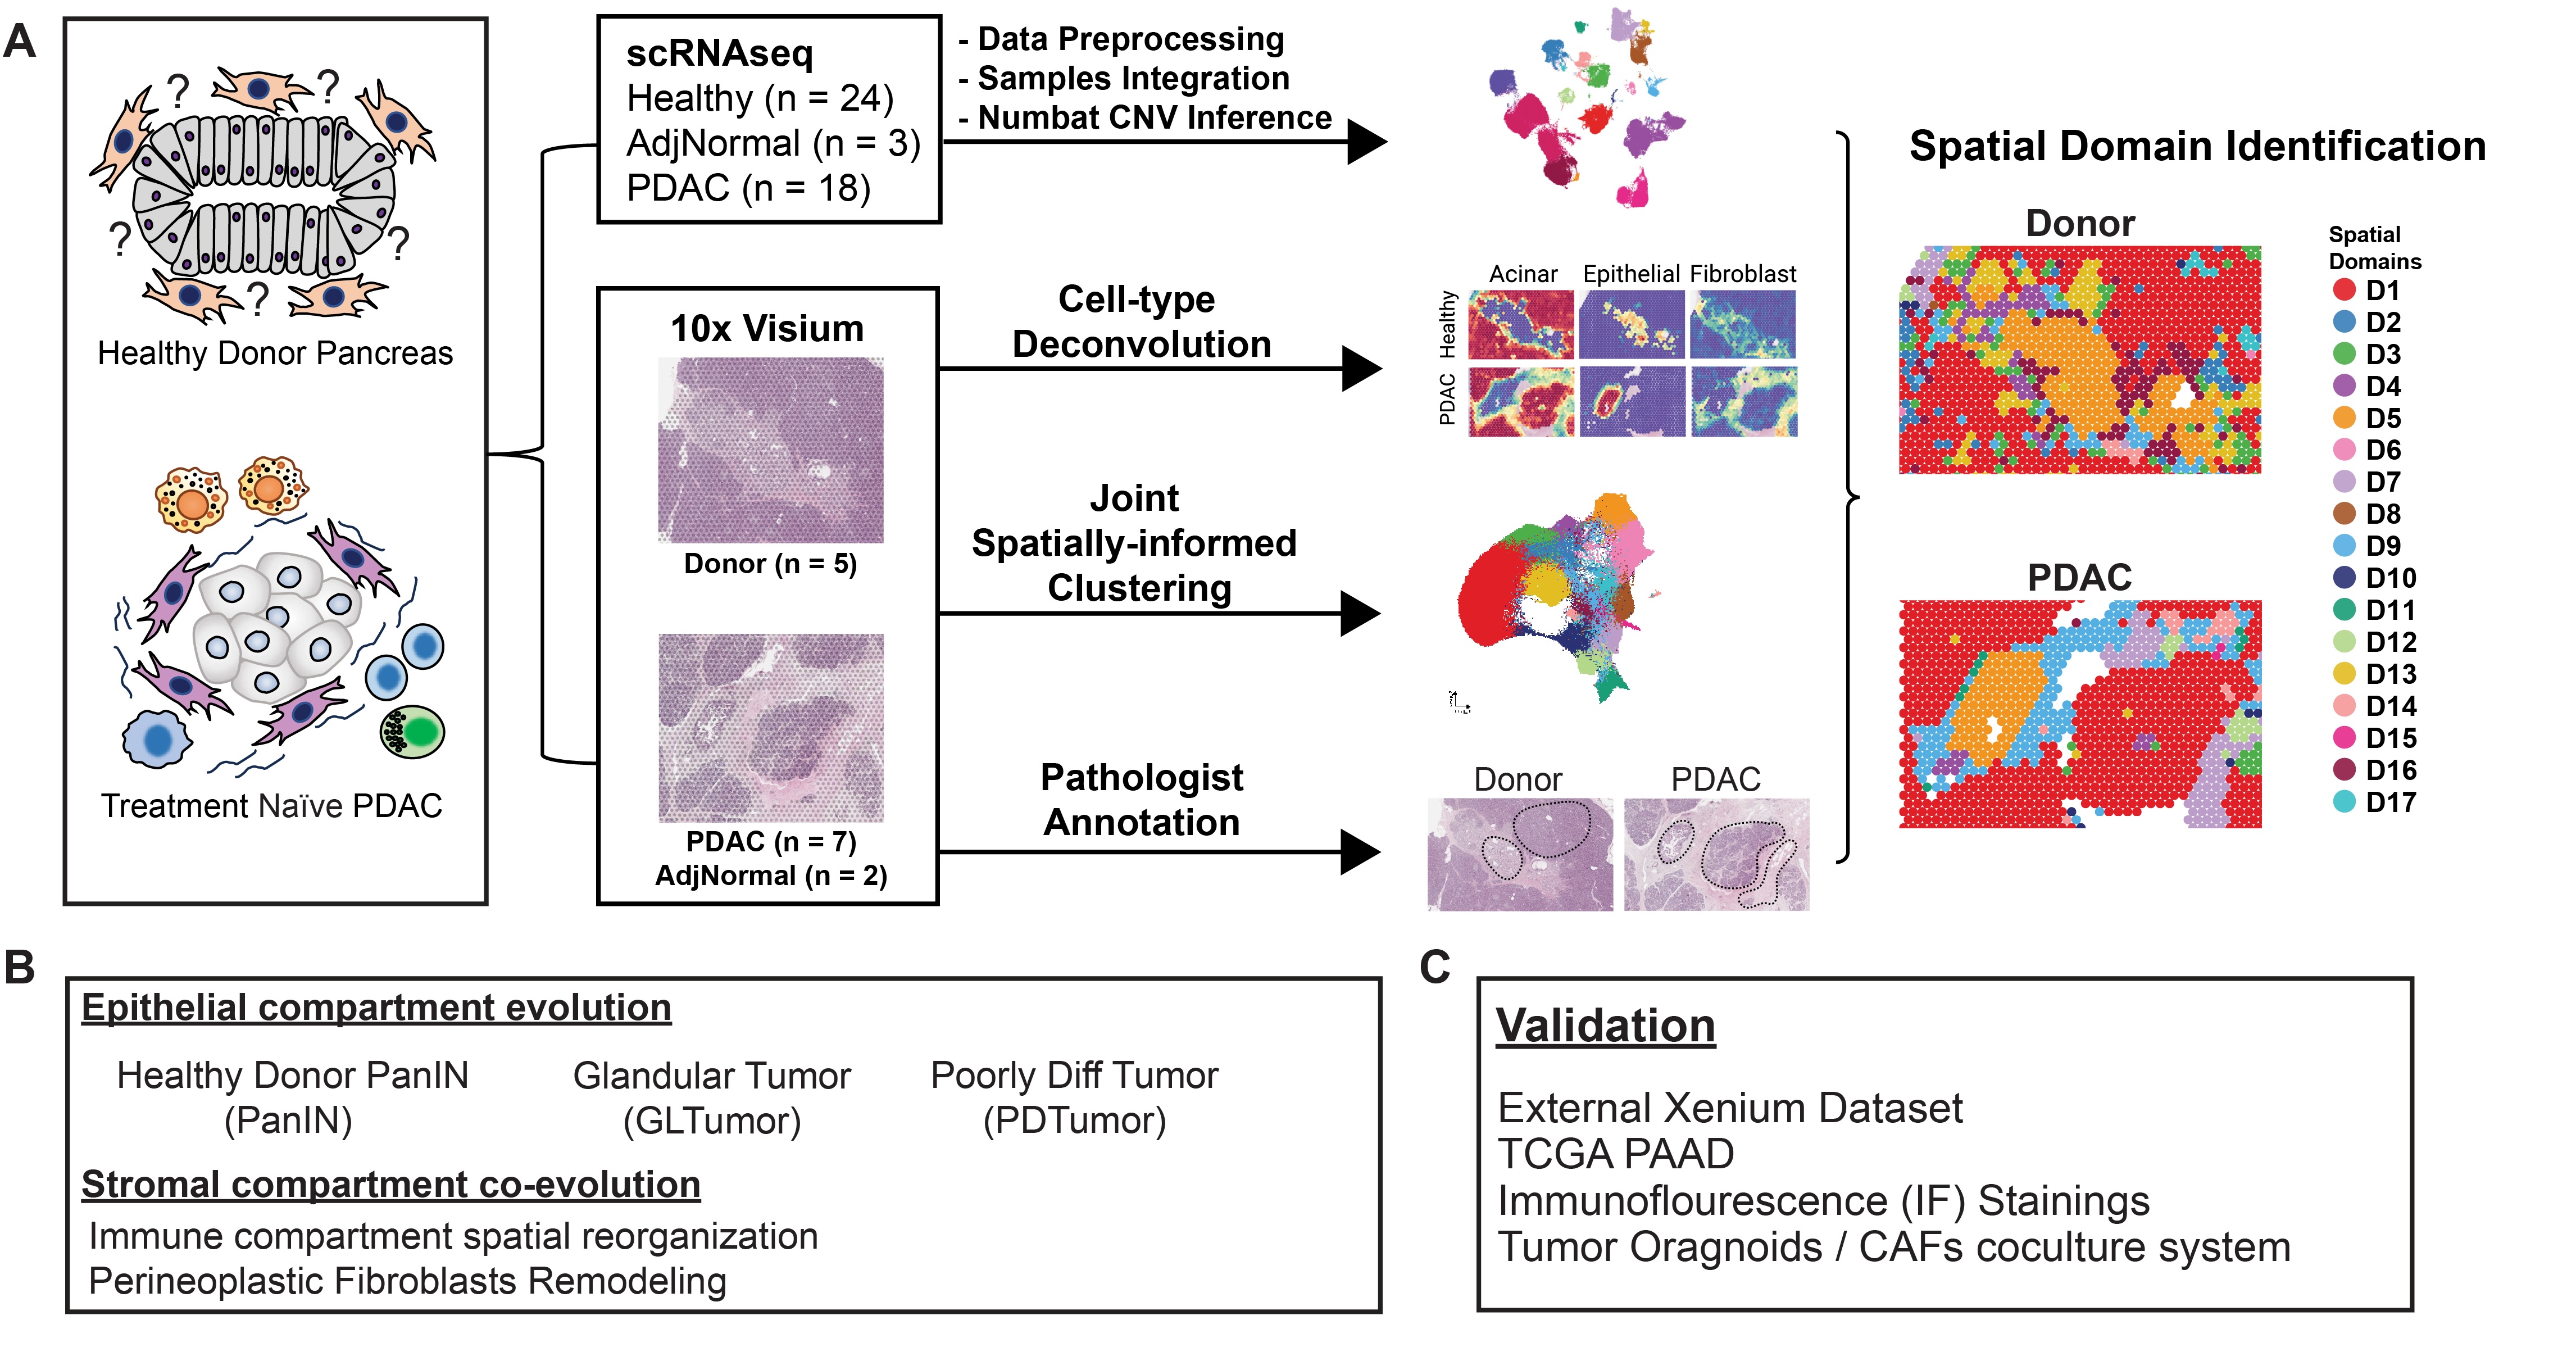
This is documentation for the code used for analysis in (Elhossiny et al. 2026). Here, we leverage single-cell RNAseq and spatial transcriptomics data to investigate the epithelial and stromal co-evolution in pancreatic cancer.
Data
We used a cohort of scRNAseq samples composed of healthy (n = 24), Adjacent normal to tumor (n = 3) and PDAC (n = 18) samples and 10x Visium samples composed of healthy (n = 11), Adjacent normal to tumor (n = 2) and PDAC (n = 7). The samples are integrated from (Elhossiny et al. 2026), (Carpenter et al. 2024), (Carpenter et al. 2023), (Steele et al. 2020) studies.
Downloading raw and processed data
- Raw data for spatial samples and full resolution H&E are availablehere
- Raw data for the new scRNAseq samples can be found here
- Raw data for the previous studies can be found in these GEO repositories: GSE229413, GSE155698, phs003436.v1.p1
- Raw data for organoids samples can be found here
- Processed data objects here
Analysis
The analysis workflow and findings are explained in detail in (Elhossiny et al. 2026).
scRNAseq Analysis
- Alignment using CellRanger as detailed here CellRanger Alignmnet
- Ambient RNA correction using cellbender (Fleming et al. 2023) as detailed here scRNAseq Ambient RNA Correction
- Quality control, processing and integration as detailed here scRNAseq Data Processing and Integration
- Copy number variation inference was done using Numbat (Gao et al. 2023) as described here CNV Inference using Numbat
- Fibroblasts and Macrophages subpopulation analysis were done as decribed here scRNAseq Fibroblast Subpopulation Analysis and Macrophages Subpopulation Analysis
- Gene set scoring on TCGA-PAAD dataset was done as described here TCGA-PAAD Scoring
Spatial Transcriptomics Analysis
Visium
- Alignment using SpaceRanger was done is described here
- Data normalization and seurat object generation is described here Spatial Transcriptomics Data Processing
- Cell type deconvolution was done using RCTD (Cable et al. 2022) is described here Spatial Transcriptomics Cell Type Deconvolution
- Integration and Spatially-informed clustering using BayesSpace (Zhao et al. 2021) is described here Spatial Transcriptomics Clustering (BayesSpace)
- Ligand-Receptor interaction analysis was done using LIANA+ (Dimitrov et al. 2024) is described here LIANA+ Analysis
- Neighborhood analysis is described here Spatial Transcriptomics Neighborhood Analysis
- Pseudobulk analysis of epithelial compartment is described here Spatial Transcriptomics Epithelial Domains Analysis
- Pseudobulk analysis of stromal compartment is described here Spatial Transcriptomics Stromal Domains Analysis
Xenium
- Segmentation was done using Proseg (Jones et al. 2025) is described here Xenium Resegmentation
- Data processing and integration is described here Xenium Data Analysis
- Spatial regression was done using semla (Larsson et al. 2023) is described here Xenium Spatial Regression
- Visualization of data is done as described here Xenium Polygons Visualization
CosMx
- Projection of Fibroblasts signature on external CosMx dataset is described here CosMx Data Analysis
Interactive Visualization
You can explore the data interactively on https://pascadimagliano-lab.github.io/PancAtlas/
Contact us
If you have any questions please feel free to contact the authors, Ahmed M. Elhossiny (hossiny@umich.edu) and Marina Pasca di Magliano (marinapa@umich.edu)